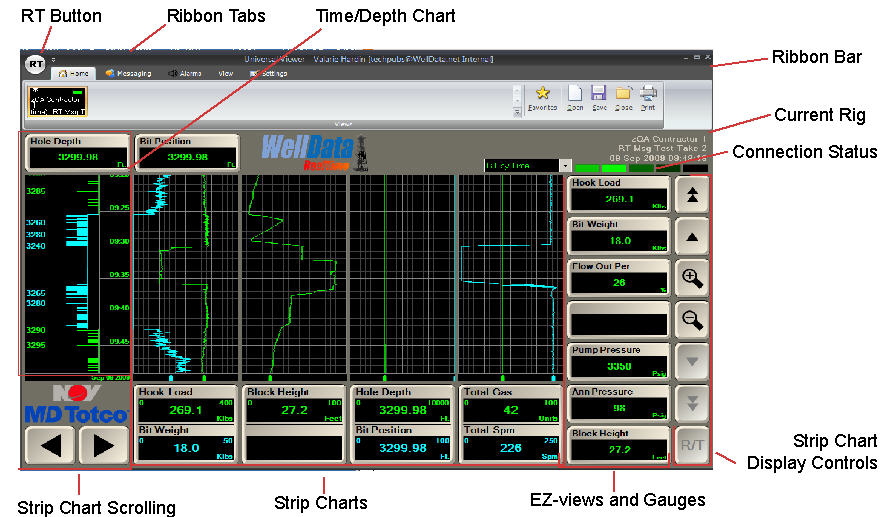
The real-time viewer is fully configurable, allowing users to view data according to their own preferences. In the sample configuration below, four strip charts have two pens each and the EZ-view section is comprised of one columns and seven rows.
The RT button, located
in the top left corner of the screen, will bring up a menu to create new
windows, save views, print views, close a single view, and close all views.
New Window: The New Window menu item opens a new instance of the RT application.
Close: Closes the current view.
Close All: Closes all open views.
Save: Saves all the settings for the current view. The first time a view is saved it will be added as a favorite to facilitate quick access.
Print: Brings up a dialog with options to print the current rig. This dialog will allow users to designate a time to print, a specific printer, paper size, and the option to print to a .pdf file. Options are also available to include grid lines and notes on the printout.
Print All: Prints all of the open views in the RT with the same printing options as Print. This will allow the user to print a snapshot of the rigs they are looking at for a specific time with ease.
About: Brings up a dialog with the version of the software that is running, as well as information about the user’s system to be used in troubleshooting.
Exit: Closes WellData Real Time.
The RT Drop-down button: next to the RT button at the top left is used to display options of the ribbon itself.

Each tab has an associated list of functions. Selecting a tab will display the available functions in the Ribbon Bar.
The Home tab will display all of the loaded views in the ribbon bar. Clicking on any view will make it the active view and it will be displayed in the viewer. To add or remove a view from the ribbon bar press the Add View and Close View buttons respectively. To save the current view’s settings use the Save View button.
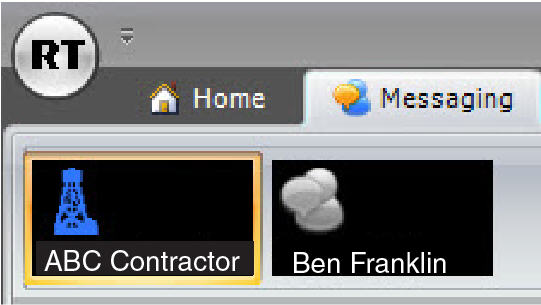
The Message tab allows users of Real Time instant messaging capabilities to other user’s. To access the message capabilities follow the steps listed below:
Select the Message tab located on the Ribbon tab on the top left of the Real Time screen.

Two message icons are now visible, the Send and History.

To send a message select the Send icon, the Real Time Communicator window launches.
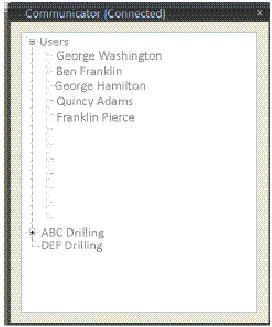
Users can select another member of their group which is listed under User’s or select a rig or contractor. A group or user is defined as anyone in the company who has access to Real Time. Double-click on the recipient and the Conservation window launches. Enter the message and select the Send button.
At any time the user can select Messaging > Send to select another name or contractor/rig to send an instant message to. At the top of the Real Time screen underneath the Messaging tab is a small messaging window indicating current conversations. Multiple conversations can be running at the same time. Toggle between the messaging windows to select the current recepient
To view past conversations select the History button.

The History Communicator window appears with past conversations listed. Double-click any recipient to view past messages.
The Alarms tab has a horn icon thatl flashes when any views are in an alarm state. Pressing the Alarms tab displays options for the audible alarm and to view all the alarms. To enable/disable the audible alarm, check or clear the Audible Alert check box. To view all of the alarms, press the View All Alarms button.
A dialog box comes up with a list of all the rigs the user is viewing and their alarm states.
In this dialog, the user can set or disable any alarm for any rig, as well as acknowledge the alarms currently in the alarm state. The user may also toggle the audible Alert on/off.
The View tab will give the user the ability to toggle between whether to display all notes, user notes, or no notes.
The Settings tab is used to configure what the user will see for the currently selected view. The user can configure the number of strip charts, strip chart pens, and EZ-views. Design mode allows the size of each individual section to be set (general layout).
To change the general layout of the screen, check Design Mode. Yellow highlights appear surrounding the borders of each section.
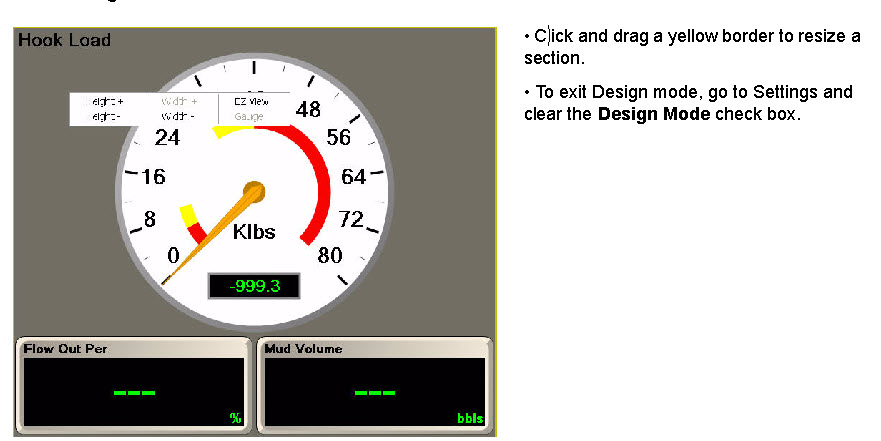
To change the EZ-view display:
Click an EZ-View or Gauge to display a display pop-up.
Click Height +/- or Width +/- to change the EZ-view size.
Click Gauge or EZ View to select how the channel will be displayed.
Use Defaults: loads the default settings allowing the user to share a configuration across views.
Apply Settings as Default: Saves settings for the current view as the default settings for all views. Any views configured to use defaults share the same configuration.
The ribbon bar displays the available functions as defined by the selected ribbon tab.
The rig information displayed on the screen is denoted by a yellow border. Each view rig icon in the ribbon bar, connection status, alarm state, and configuration pending are shown in a view that has pending changes is denoted by an asterisk (*). A view may have “No Available Well” displayed if the rig is not currently on a well, or if the user does not have access to the well specified. If the well has an alarm, it will be denoted with a yellow (warning) or red (alarm) flashing square.
Favorites: provides the user with quick accessibility to the views that have been previously opened and saved via the Saved Rigs dialog. The Saved Rigs dialog allows the user to simultaneously load multiple views by selecting the check box of each desired view and using the Load button. Views listed in the favorites list can be removed using the Delete button. To automatically load a specific set of rigs when starting the Viewer from the menu bar, click beside the rig under “Load at Startup”.
Open: Adds a view (rig) to the ribbon bar. A prompt will appear for user to choose rig to put in view.
Save: Saves the settings of the current view. The first time a view is saved it will be added as a favorite to facilitate quick access.
Close: Closes the current view and removes it from the ribbon bar.
Print: Opens the print dialog box to print the current view.
Green: A scrolling green connection status indicates that the system is functioning properly.
Yellow: A flashing yellow connection status indicates that the real-time server cannot connect to the rig, a well has not been started on the rig, or the user does not have permission to view the rig requested
Note: When a client first tries to connect to a rig, the connection status will be yellow until the connection to the rig is made.
Red: A flashing red connection status indicates that the client cannot connect to the real-time server.
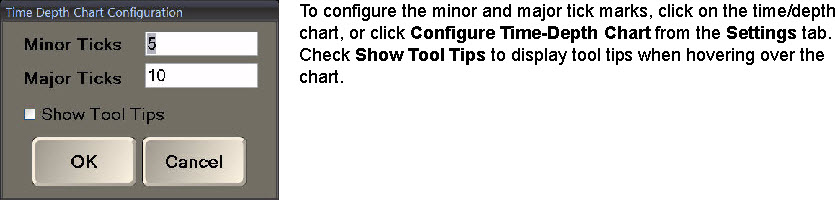
The Time/Depth Chart is used to determine the bit position in relation to the hole depth over a specified time. When the bit is off bottom, the tick marks and the depth will appear in blue. When the bit is on bottom, the tick marks and depth will appear in green and the tick marks will be indented to the right.
In this illustration, the bit is off bottom and then moves to on bottom of the hole at 16:38.
To access the Directional Survey screen, select Directional Survey from the view drop-down
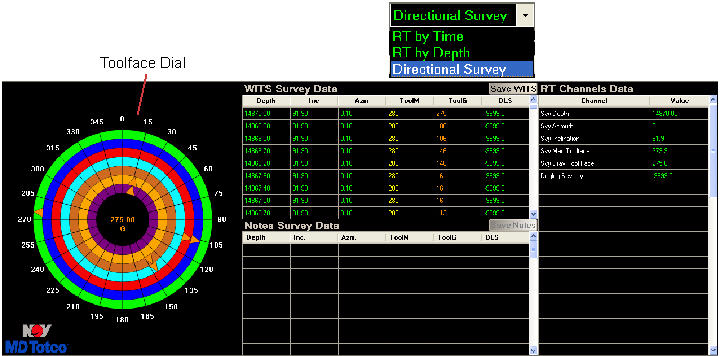
The toolface dial shows the direction to which the downhole motor is oriented. Measurements can be either magnetic or gravitional (magnetic is referenced to North, and gravitional is referenced to the high side of the well). When a Magnetic Toolface is displayed, an M displays when the Gravity Tool Face is displayed, a G displayed
Click the toolface to display the Toolface Dial Configuration pop-up.
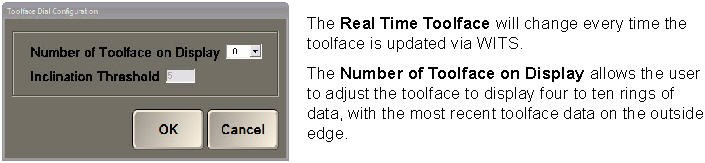
The toolface can be configured to display a historical record of toolface positions in real-time or directional toolface positions from an MWD tool. There is a slight data transmission delay in the real-time data due to the data transmission speed of the MWD tool.
Surveys are logged in the tables to the right of the rosebud and include:
|
|
|
|
|
|
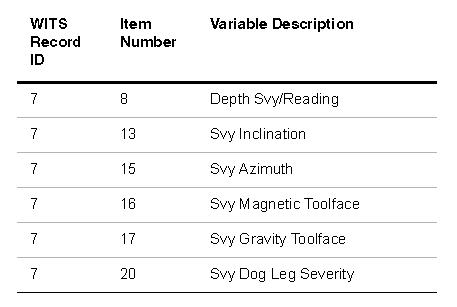
WITS Survey Data: This grid displays up to 5,000 surveys that have been sent to RigSense via WITS. WITS channels that are required for the toolface are listed below:
|
|
Note: Some company policies only allow sending approved surveys. |
Notes Survey Data: Displays surveys that are entered as a canned note in RigSense. This can be helpful if the MWD company is sending surveys to RigSense that have not been approved.
RT Channels: Display the real-time value of user defined channels. Click anywhere in the table to select and/or order the channels displayed.
 A strip chart is used to view both the current and
the historical value of a channel.
A strip chart is used to view both the current and
the historical value of a channel.
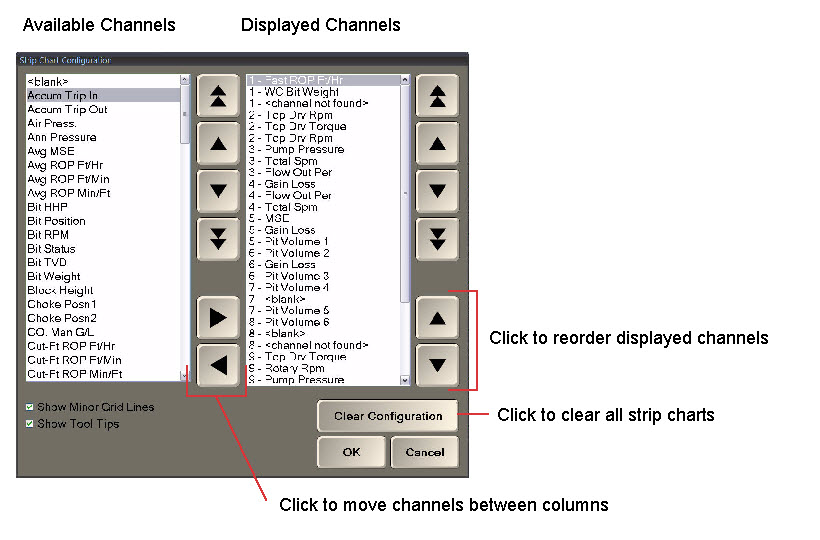
The left and right arrow buttons can be used to scroll between charts if more columns of charts are configured than strip charts displayed.
To change the order of the strip charts, click any one of the strip chart graphs or choose Configure Strip Charts from the Settings tab.
An EZ-view is a button displaying real-time data for a specified channel.

|
|
Note: The EZ-view will turn red or yellow to indicate an alarm/warning state for that channel. |
A channel may be displayed as an EZ-view or gauge. To toggle between the modes, enter design mode, and click the EZ-view to change it. See See Design Mode for details regarding the design mode.
Outside of design mode, clicking on an EZ-view or gauge opens a configuration dialog box. Both configurations have buttons that change how the channel is displayed. In addition, the gauge configuration dialog allows the gauge scales, the direction of the gauge, and the value of major and minor tick mark intervals to be changed.
Alarms can also be set in this dialog and display in yellow (warning) or red (alarm) on the gauge.
